Private Wealth

The only thing we have to fear is… fear itself.

The first inauguration of Franklin D Roosevelt

Much is being written in 2021 about price inflation, debating its persistent or transient nature, and conveying a general worry over the impact of inflation on asset prices. With this note, we hope to explore the history of inflationary periods to determine how much inflation impacts fundamentals and how much market action is merely fear itself.

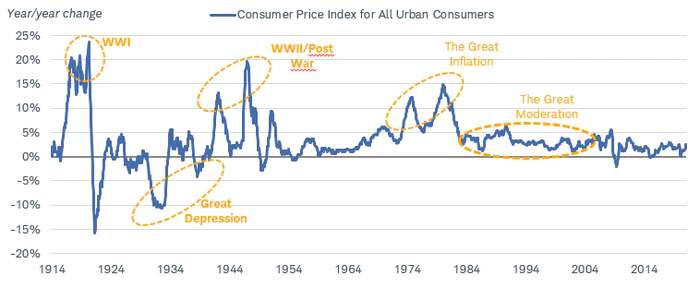
Investors with some age on them have been shaped by the period of elevated inflation in the 1970’s. As the graph below shows, most other inflationary periods have been associated with wars — with prices spiking from wartime shortages and then deflating when supply/demand conditions returned to balance. But the inflationary period of 1973-74 was different and not associated with wars but with monetary policy. Stock prices during this period declined by more than 45%, and bonds saw coupon interest undermined by declining principal value from rising rates.

Interestingly, the battle against inflation didn’t actually commence until after the Nixon Administration’s easy money policies had been abandoned and the Volcker Fed commenced a high interest rate regime to “break inflation’s back” in the early 1980’s.

Given the noise in the markets today, one would expect that this would have been a horrific period in which to be an investor. But despite persistent inflation during the ten years following the ’73-‘74 bear market, eight years were positive for equities. Bond returns were positive a similar percentage of the time. And shockingly, S&P500 returns (including dividends) averaged more than 15 percent per year during this decade. It would appear that inflation surprises are more important than inflation itself.
What does one make of this revelation, and how does it relate to private investments?

First, one must admit that market averages hide the volatility that affected many companies and sectors. Those bear market years were most difficult for high multiple growth stocks whose prices often declined by more than 80%. (Remember that Avon Products and Coca Cola were growth stocks of that era.)  Clearly, future earnings are worth far less in a high inflation environment. Similarly, lower quality names with high leverage were also decimated as the rising cost of leverage took its toll on free cash flow and solvency.

In the current era, the private equity industry has thrived in this period of lower cost leverage, allowing managers to widen their view of potential targets and buy at ever higher valuations. Assuming “real” rates of interest behave logically, then higher inflation would raise financing costs and put marginal deals out of reach. We would expect skilled managers to continue to succeed in such an environment, while those without an edge would eventually point their careers elsewhere. Investors without a coherent strategy may find this new paradigm less than accommodating.

The takeaway for private investments, therefore, is not that inflation is scary, or that it is benign. The observation is that low leverage strategies should endure. Skilled managers and sponsors in private equity can continue to add value. Enterprises with pricing power will better be able to navigate whatever environment exists. And certain real estate categories are clearly inflation hedges, with rents that adjust over short time periods. Conversely, highly leveraged strategies and overpaying for growth are risky endeavors when discount rates rise.

At Altera, we strive to identify strategies with real value-added as opposed to “prosperity through financial engineering”. We seek enterprises with pricing flexibility and modest leverage. We favor durable revenue streams, even at the expense of being a little dull. We are long term investors in long duration assets.
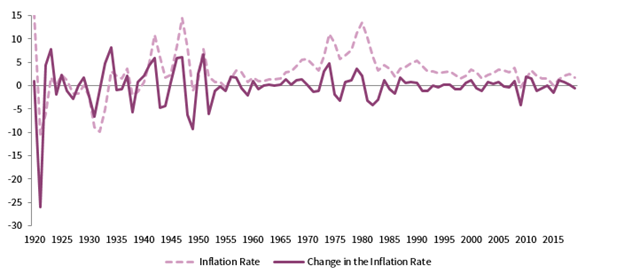
We can’t predict inflation rates, or whether or not the current spike will endure or prove to be transitory. But as history has shown (in the graph above), change IS the constant, and inflation rates are just as likely to surprise on the downside as the upside. This makes the entire inflation discussion (for long term investors in private securities, anyway) as much a media-driven phenomenon as it is a fundamental one.

Today’s investors are challenged to find yield in a low-rate environment and appreciation potential in a world of highly valued equities. They are increasingly looking to alternatives to meet their financial objectives. When investing in alternatives, however, some of the greatest challenges for an investor are determining the true level of risk being taken and assessing what is an acceptable rate of return for that level of risk.

In public securities, risk is often couched in terms of volatility. But for illiquid private investment vehicles, risk is more likely to be defined as the likelihood of a permanent loss of capital. Each definition can be applicable to a particular situation, but defining risk is more multi-faceted than this, and return targets surely aren’t all created equal.

As we will describe below, there are times when a seemingly mundane investment with a 12% target IRR is just what a portfolio needs.

Embracing Illiquidity Risk

In addition to bearing the risk of loss, investors in private securities face a lack of trading liquidity. The lack of a daily mark-to-market valuation can make private investments a stabilizing factor in a portfolio, at least over the short term. While surely not an indication of a lower risk level, this draws attention to the weakness of using volatility as a primary measure of risk. It also highlights how public securities can react strongly to market and economic factors, adding to portfolio volatility, while private valuations are much slower to change and are driven by operating fundamentals more than by short term views.

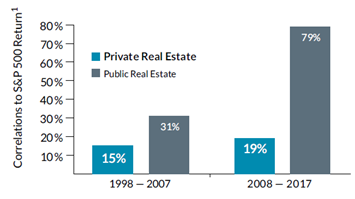
Private Real Estate has lower correlation with S&P500

Even if one assumes that illiquidity delivers a possible benefit to offset investor emotions, an investor should still be compensated for the lack of trading liquidity of any investment. In practice, it seems that we usually are. An example of private real estate investments versus publicly traded REITs shows a yield premium of more than one percent for private funds and a far lower correlation of returns with the S&P500 (shown at right).

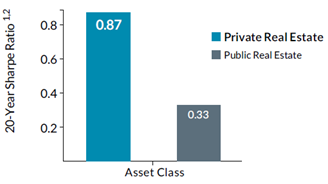
Higher Sharpe Ratio for Private Real Estate

Likewise, a comparison (at left) of the Sharpe Ratio of public versus private real estate shows that the private investment has delivered more return for each unit of risk.

The concept of illiquidity risk circles back to the concern over volatility: Both are risks that an investor may have an unexpected need for funds (either from true need or emotional reaction) and may find it necessary to liquidate investments at the worst possible time. But the investor who can accurately forecast their liquidity requirements has an inherent advantage. Rather than being concerned over the illiquidity of a part of their portfolio, they can budget for the amount that needs to remain liquid (and subject to the volatility of the financial markets) with the remainder focused on the long term and earning an “illiquidity premium” and potentially higher returns.

In short, turning the liquidity question on its head could yield a portfolio with a more efficient risk/return tradeoff.

Reducing of Correlation Risk

While investors may be compensated for illiquidity, they are not usually compensated for incurring correlated risks (i.e., the risk that two investments behave in the same way at exactly the worst time.) When an investor expands their opportunity set by including private investments, they increase the likelihood that they can incorporate vehicles that have a lower correlation of returns.

In practice, correlation risk can and should be diversified away where possible, but this aspect of investing is often neglected when investors put on their “deal hat” and not their “portfolio hat”. When taking a portfolio perspective, it becomes clear that identical 12% target IRRs are NOT of equal value if one of them is highly correlated with existing positions. Adding true diversifiers with the same target return improves portfolio efficiency, again delivering more potential return for each unit of risk.

It is also important to view each investment’s target IRR as a central point amid a range of possible outcomes, some of which may be negative. And when the same risk factors (i.e., interest rates or economic growth) are the main drivers of returns for more than one investment, the investor may be multiplying their risks despite investing in what appear to be thematically different stories.

Portfolio management is therefore about trade-offs, and where possible, about upgrading portfolios to perform better over time for the risks that are being taken. Investments aren’t viewed in a vacuum, but rather in comparison with existing holdings and possible alternatives.

With stock returns having averaged 10% per annum over the past 50 years, an alternative investment fund with a 12% target IRR and no correlation to the S&P500 can look like a winner for an investor who can allocate to private alts. With US large cap equities at elevated valuations, the case for alternatives is even stronger.

Seeking “Alpha” and “Beta”

At Altera, we assess an investment’s return potential and its risks, looking at both the broad asset class and the specifics of the investment itself. Our process tends to produce eclectic investment vehicles where one of the largest risks factors is often manager execution. We focus not just on getting the “beta” (return of the asset class), but also on finding those independent sources of “alpha” that add value through execution in a specific segment at a particular point in time.

For example, “manager execution” might be delivered by improving the profitability of a self-storage facility after acquisition, increasing its yield and its market value. It might be in the selective acquisition of underperforming hotels or in a manager’s process of acquiring so-called “dull” companies at low valuations and providing capital to consolidate other competitors into a larger, more valuable entity.

In these examples, manager execution is about more than owning an asset and riding the wave of a market cycle or organic growth. It is about making more from what’s there, adding to the potential return of an investment, independently of the macro factors at work. When investors can earn alpha (from the value-add) and beta (from the asset class), their chances of earning returns that are less correlated with their other investments increases greatly.

The conclusion is that a portfolio mindset seeks diversification of certain types of risk, attempting to minimize some while embracing others. By specifically targeting different sources of alpha, this process could deliver a better outcome over the long term, even while incorporating the occasional 12% IRR fund.

1 Sources: Bloomberg, NCREIF, NAREIT 20 years ended 12/31/2017.

2 The Sharpe Ratio is a measure of excess return on an asset above a risk-free rate relative to the standard deviation of return of that asset.

3 JPMorgan 2021 | 25th Annual Edition — Long-Term Capital Market Assumptions

Of Expectations and Allocations

Each year, major investment firms make their assessments of the relative attractiveness of the main investment asset classes. They typically provide expected returns for the next decade. These numbers can be eye-opening when they deviate widely from historical results, while at the same time, the portfolio allocations recommended by such firms seldom reflects these expectations.

Some might refer to this as “talking out of both sides of your mouth”, but let’s be charitable and say that their recommended allocations reflect their short-term expectations. (It is also possible that low expected returns for both stocks and bonds cause them to arrive at the same allocations as before.)

That said, the logic behind the long-term return expectations of these firms is usually well supported. As with, say Vanguard, their ten-year US equity returns are based on currently elevated valuations and low dividend yields, delivering about a 5% expected return per annum through 2031.1 This is roughly half of the 10.6% average annual returns that investors have earned over the past 30 years.

If these returns turn out to be correct, then investors will need to seek other avenues for appreciation if they are to meet their asset growth objectives.

Looking Beyond Traditional Assets

Institutional investors have long sought to diversify their sources of returns, finding fertile ground in private equity, private credit, real estate, and venture capital. They may not have had lower S&P 500 return expectations in mind when they added private investments to their portfolios, but the 490bp return premium2 on private versus public equity over the past 20 years still provided ample motivation to make a shift.

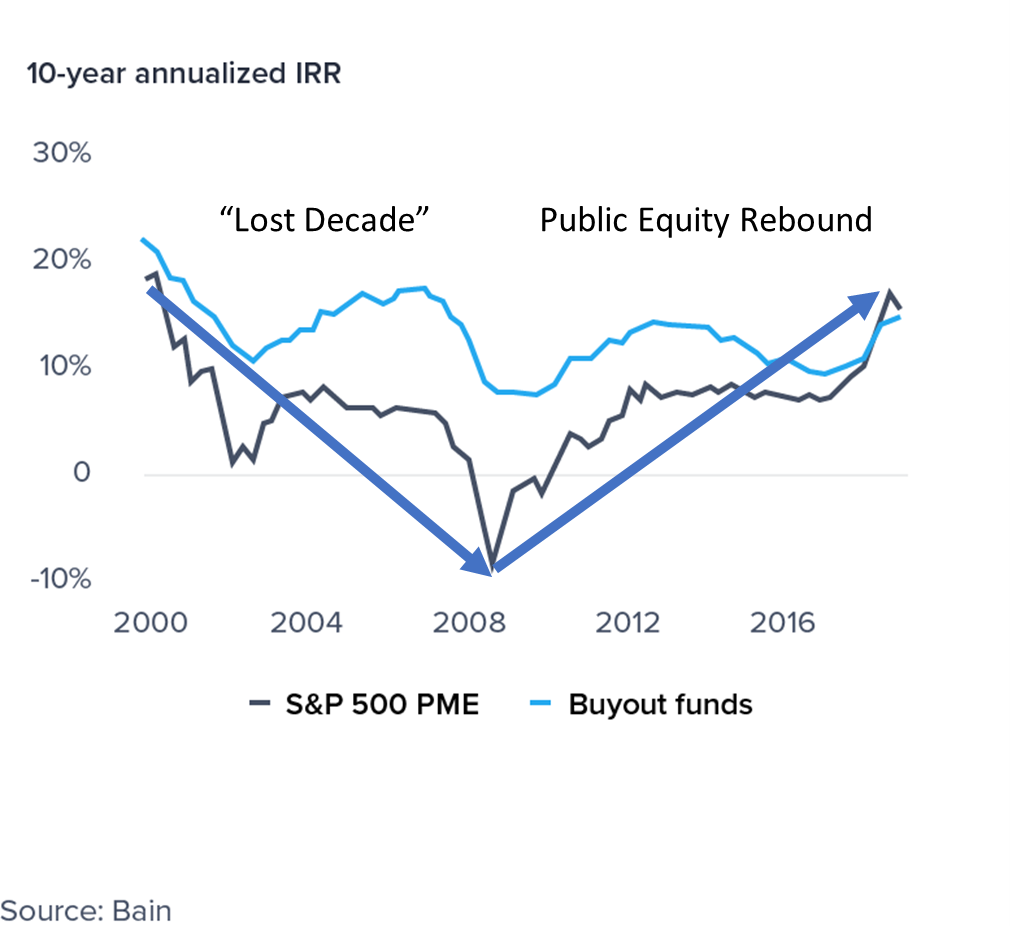
It is important to note that the 20-year record of outperformance, referenced above, was driven to some degree by the elevated valuations of public equities in the year 2000. The so-called “lost decade” in the S&P 500 was a consequence of the elevated valuations of technology firms at the start of the period — and the more defensible appraisals at the end.

How similar is that environment to today’s lofty multiples?

As the chart at the right illustrates, an analysis of ten-year returns periods from private equity versus the S&P 500 shows two things: The rebound of public equities from that lost decade, and the far greater cyclicality of public market returns versus private. The most recent leadership of public equity versus private coincides precisely with elevated valuations on public shares. It can be argued that this performance advantage could therefore be temporary, completing the 20-year cycle.

Public Markets Benefited from Liquidity

In the COVID-19 environment, accommodative monetary policy has boosted money supply. McKinsey estimates that central banks have injected $9bn into financial assets worldwide in the current environment versus only about $2bn during the 2008-09 financial crisis.3 It is widely assumed that a large share of this money has made its way into the public equity markets. This, along with a larger pool of retail investors, has resulted in elevated valuations among US public equities.

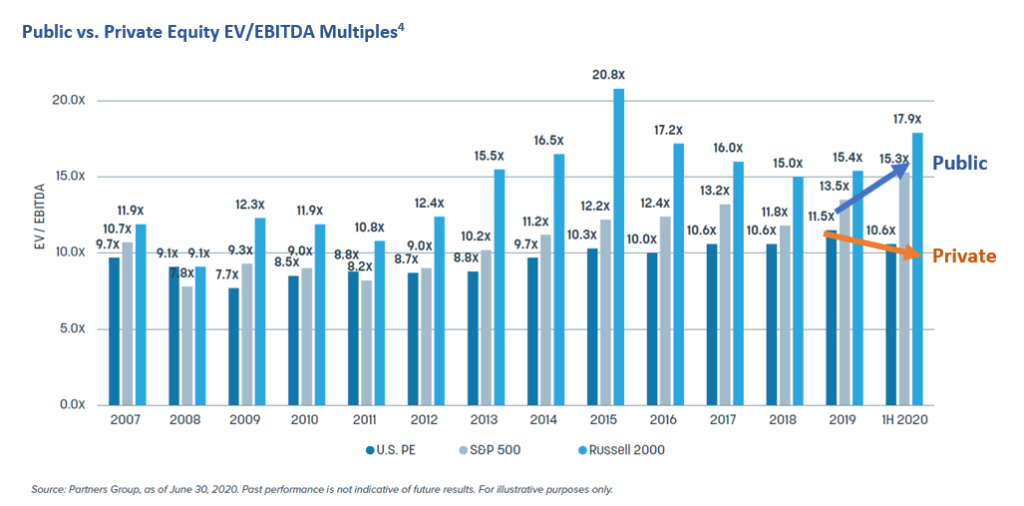
Private equity acquisition multiples have also risen modestly over time, but then fell back during the pandemic while public equities continued to climb. The presence of low borrowing costs for private deals is clearly correlated with the low interest rate effect on public equity multiples. It is much harder to argue, however, that central bank liquidity has filtered into private equity flows. More than $2.5tn of dry powder held by buyout firms has been a fixture for several years and is not a recent phenomenon.

Can Private Equity Lead Again?

Investors can surmise that large buyout firms must do increasingly larger deals. Studies also show that higher entry multiples are directly related to lower fund returns.5 Taken together, the outlook for PE is tempered by the inevitable presence of mega deals and high valuations. It then follows that the lower and middle market segments should have less difficulty placing capital and may not be burdened by elevated entry multiples.

Altera’s focus on this segment, and primarily with funds that favor lower valuation multiples, leads us to expect a wind at the back of such funds. We see such skilled private capital allocators continuing to add value for firms positioning for a founder’s exit, seeking growth capital, or desiring financial and operational resources during a difficult environment.

Relative to overpriced public equity indexes, lower and middle market private equity has the potential to both diversify and enhance investor returns over the coming decade.

For many years, the default allocation for a large number of investors has been the “60/40 Portfolio” — an allocation so titled for its 60% portfolio weight in stocks and 40% allocation to bonds.

The conditions that made this allocation work so well, however, are no longer in place. In this article, we outline other options that should help investors to meet their financial goals without taking on large amounts of additional market or credit risk.

THE 60/40, AND A NEW APPROACH

The simplicity of this allocation was part of its strength. Over the years, its ability to mitigate volatility without a big reduction in performance made it valuable to investors who wished not to endure the full volatility of the equity markets. To use a badly worded metaphor: One could have their cake and eat it, too.

This attractive mix was possible thanks to two factors that no longer exist: Relatively high interest rates and fair valuations on stocks. A 40-year decline in inflation and interest rates created a wind at the back of both stocks and bonds, pumping up the returns of both. And now, bond yields are in the very low single digits and stock valuations are approaching all-time highs.

What is an investor to do when the wind that was once at one’s back is no longer blowing?

To make the 60/40 work in the current environment, investors need to take on different portfolio exposures and different risks. Low yielding bonds need to be replaced by, or at least supplemented with, higher yielding vehicles. Overvalued stocks need to similarly be paired with more attractively priced choices.

Put simply, investors should look at assets in the private markets. All things equal, private investment valuations should be below those of the equivalent investments in the public markets and yields commensurately higher, as compensation for the lack of trading liquidity.

But what if this lack of liquidity was a benefit, not a drawback? By definition, an asset that is priced monthly, or quarterly, will have less volatility than one whose price updates every second. That does not reduce the chance of principal loss in a private investment, of course, but it does mean that such vehicles in a portfolio could create a smoother ride for the investor.

Both affluent investors and institutions have liquidity needs that need to be carefully monitored. But those same investors likely have a portion of their portfolios that will remain invested for years or even decades to come, with no need for funds to be distributed. Investors who create a budget for illiquid investments can harvest the returns associated with that lack of trading liquidity.

PRIVATE CREDIT

The opportunity in private credit was created, in part, by the increased scrutiny of bank lending activity. Higher capital costs associated with loans to mid-sized firms effectively forced banks into to the larger end of the lending market, creating an opportunity for private lenders to fill the void.

For bond-like investments of similar credit risk, a private credit vehicle will typically post yields higher than those of the public market equivalent. A study by TIAA Global Asset Management found that private loans carried an “illiquidity premium” of 100-200 basis points (1-2%) versus syndicated loans, despite a lower default rate.

Middle market lending has even higher interest rates than one finds in the public or large corporate market, on top of the illiquidity premium. In fact, it is not unusual to find private lending vehicles yielding upwards of 9%. It is also important to note that private loans could be based on floating rates, reducing the interest rate risk of the instrument to the investor should rates rise.

There are many different segments of the private lending market, with varying risk and return characteristics. Investors are wise to carefully consider the characteristics of each one. The bottom line is that this segment is decent place to look for possible portfolio yield enhancement.

PRIVATE EQUITY

The catch-all term of “private equity” is used here to include private investments across a wide array of categories from private real estate to infrastructure to venture capital.

The characteristics of such investments will vary greatly, of course, but a common theme across many of them is higher cash flows to investors versus publicly traded securities. It is not unusual to see private investments with cash flow yields between 5 and 7 percent. In the public equity markets, the S&P500 has a current dividend yield of less than 1.6%.

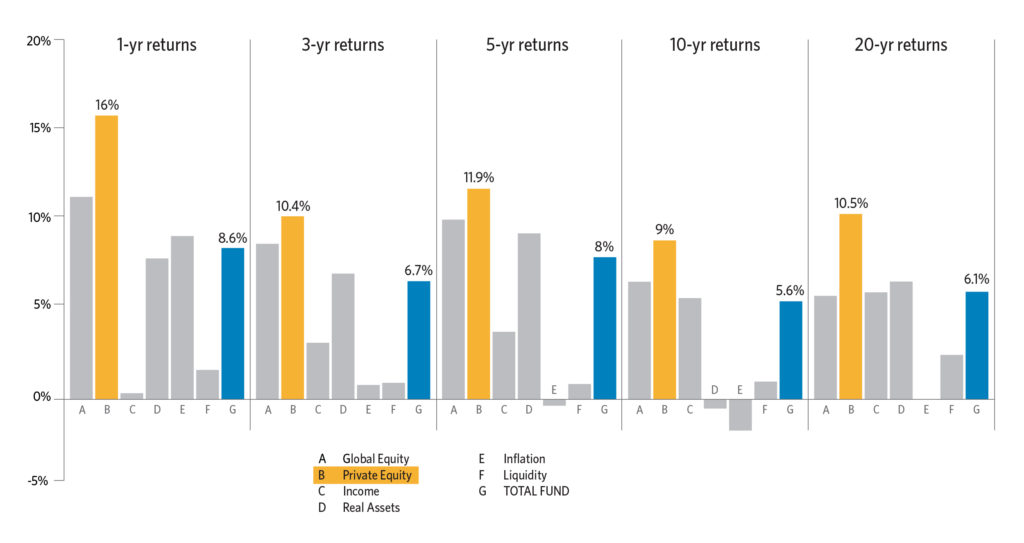
The attraction to these asset classes has been their historic return premium over listed equities. Cambridge Associates estimated this return premium to be 500bp per year over the 25 years through 2016. Similarly, retirement fund CalPERS (in the graphic below) showed a 500bp return advantage for their private equity investments over their public ones over a 20-year period.

Investors are cautioned that averages can be deceiving. The so-called “vintage year” of a private fund is among the most important factors in determining whether a particular fund does better or worse than the average. Years following recessions have typically been among the better vintages for both venture and private equity funds.

Niche-focused lower and middle market strategies often overlooked by large, mainstream investors and purveyors of mega-sized private funds. These strategies are difficult to execute at a $1bn scale. And they often rely more on micro-level strategy execution than macro-level valuation upgrades. Their “alpha”, therefore, is dependent on different drivers than those that impact the broader market, making them potentially better portfolio diversifiers.

CONCLUSIONS

Investors can draw conclusions from the relative success of other investors who have walked a similar path. Cambridge Associates tracks hundreds of institutional investors with varying allocations to alternatives. Their simple conclusion (in the chart below) was that the most successful of these investors were the ones who allocate more than 15% to alternative investments, averaging more than a 1.8% return advantage over those who allocate just 5%.

In the current environment of low interest rates and richly valued stocks, these lessons can be liberally applied to the 60/40 portfolio. Individual investors and small institutions have the added benefit of being able to execute niche alternative strategies to potentially enhance their long-term returns.